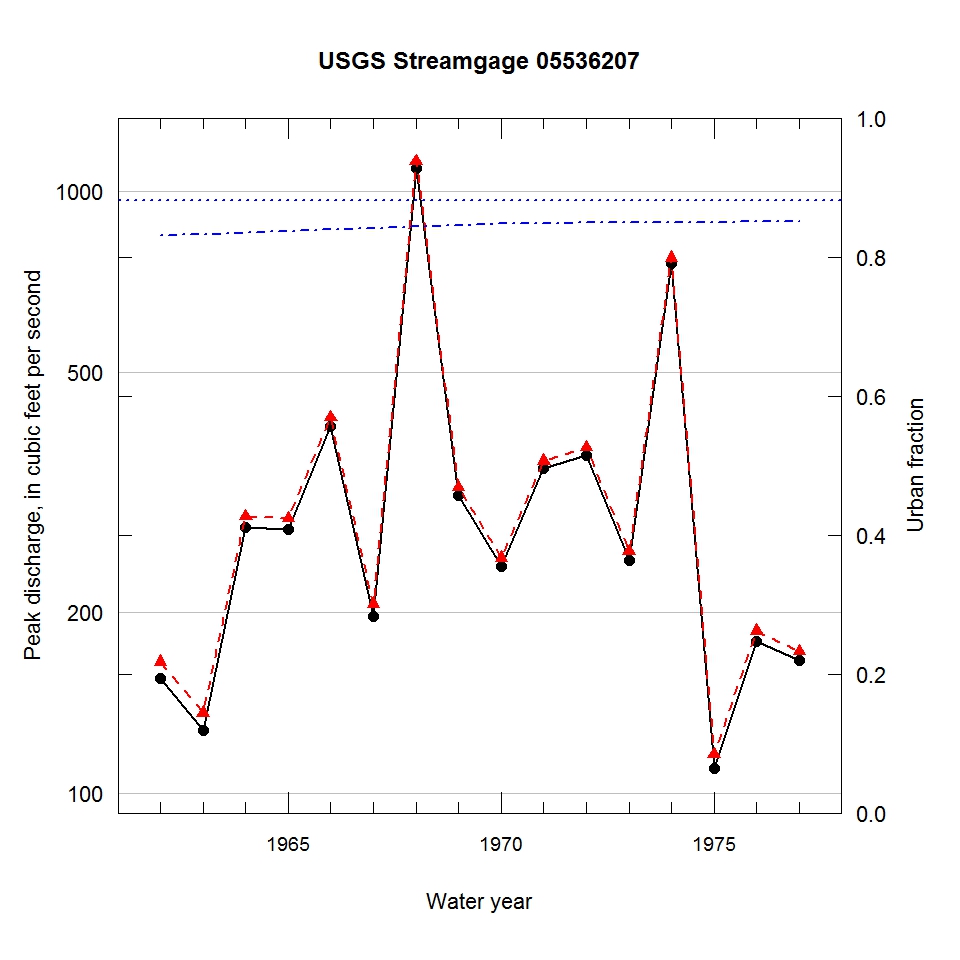
Observed and urbanization-adjusted annual maximum peak discharge and associated urban fraction and precipitation values at USGS streamgage:
05536207 THORN CREEK TRIBUTARY AT CHICAGO HEIGHTS, IL


| Water year | Segment | Discharge code | Cumulative reservoir storage (acre-feet) | Urban fraction | Precipitation (inches) | Observed peak discharge (ft3/s) | Adjusted peak discharge (ft3/s) | Exceedance probability |
| 1962 | 1 | -- | 0 | 0.830 | 0.650 | 155 | 165 | 0.737 |
| 1963 | 1 | -- | 0 | 0.833 | 2.298 | 127 | 136 | 0.861 |
| 1964 | 1 | -- | 0 | 0.835 | 1.817 | 276 | 288 | 0.210 |
| 1965 | 1 | -- | 0 | 0.837 | 1.797 | 274 | 286 | 0.217 |
| 1966 | 1 | 2 | 0 | 0.839 | 3.894 | 406 | 421 | 0.054 |
| 1967 | 1 | -- | 0 | 0.842 | 1.549 | 197 | 206 | 0.534 |
| 1968 | 1 | -- | 0 | 0.844 | 4.941 | 1090 | 1120 | 0.000 |
| 1969 | 1 | -- | 0 | 0.846 | 1.956 | 312 | 322 | 0.154 |
| 1970 | 1 | -- | 0 | 0.848 | 1.738 | 238 | 246 | 0.352 |
| 1971 | 1 | -- | 0 | 0.849 | 1.579 | 346 | 356 | 0.106 |
| 1972 | 1 | -- | 0 | 0.849 | 1.219 | 364 | 375 | 0.086 |
| 1973 | 1 | -- | 0 | 0.849 | 1.429 | 244 | 252 | 0.324 |
| 1974 | 1 | -- | 0 | 0.850 | 4.242 | 758 | 775 | 0.008 |
| 1975 | 1 | -- | 0 | 0.850 | 1.260 | 110 | 116 | 0.930 |
| 1976 | 1 | -- | 0 | 0.851 | 1.859 | 179 | 186 | 0.633 |
| 1977 | 1 | -- | 0 | 0.851 | 1.998 | 166 | 172 | 0.706 |

